

Zilliqa (ZIL) Prints Strong Bullish Divergence: Is the Market Preparing for a Major Rally?

- ZIL has held a descending support line with repeated bounces and no lower lows in three years.
- The RSI shows bullish divergence, signaling consistent upward momentum near each support test since 2022.
- ZIL trades at $0.01063 with 0.06% daily gains and 18.42% drop in volume, reflecting steady but quiet market activity.
Zilliqa, a blockchain that supports smart contracts and decentralized applications (dApps), has seen notable movement in its native token ZIL. As of the recent update, the ZIL token continues to hold a descending support level that has remained intact since mid-2022.
The price has tested this support line multiple times, bouncing from similar zones. Each reaction led to a short-term upward move. The recent price action shows ZIL is once again positioned near this support, with signs of compression forming across the structure.
Zilliqa Long-Term Pattern Holds Price Above Key Support
The chart presents a descending pattern where ZIL trades between $0.01 and $0.015. The lower boundary has served as the main support zone. The support line has not broken in over three years. Past touches at this trendline have preceded price gains of over 100%. The price remains below horizontal resistance, but no lower low has occurred since 2022.
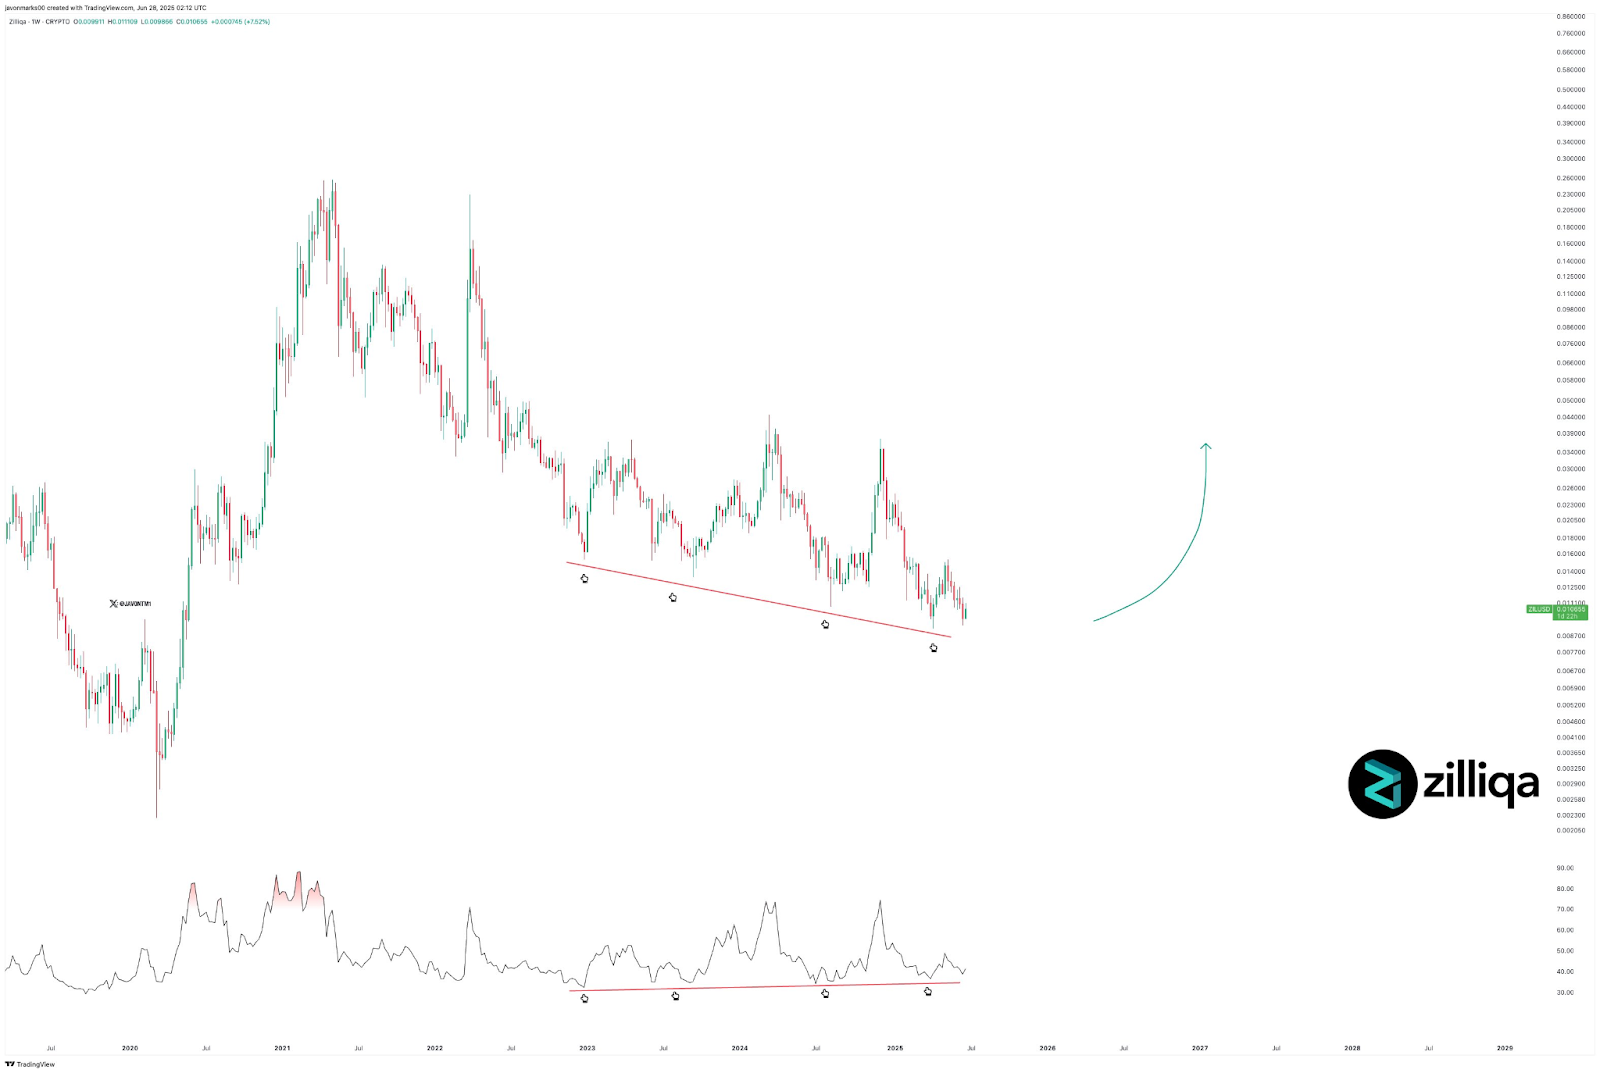
The Relative Strength Index (RSI) at the bottom of the chart shows a bullish divergence. While the price recorded lower lows, the RSI made higher lows. This divergence has occurred consistently over the last three major price touches at support. MACD patterns have also aligned with these RSI movements based on referenced signals, even though the MACD is not visible on the chart.
Breakout Target Points to $0.044 Range
A projected move is marked on the right-hand side of the chart. The curve projects a target between $0.044 and $0.045. Previous recoveries from the same trendline resulted in multi-month gains, though current levels remain confined within a descending channel. The chart covers activity from 2020 through 2026, giving a multi-year view of the asset’s price behavior.
The chart shows narrowing price ranges in recent months. Volume data is not shown, but price compression is visible in recent candles. Each contact with the support line corresponds with a visible reduction in volatility. The setup has remained consistent, showing that price still respects the established support.
What is the Current Market Movement?
According to CoinMarketCap data at the time of writing, Zilliqa (ZIL) is trading at $0.01063 with a 0.06% gain over the past 24 hours. The market capitalization stands at $207.47 million, reflecting slight growth. Daily trading volume has dropped 18.42% to $7.95 million. The price fluctuated between $0.01058 and $0.01070 during the session.
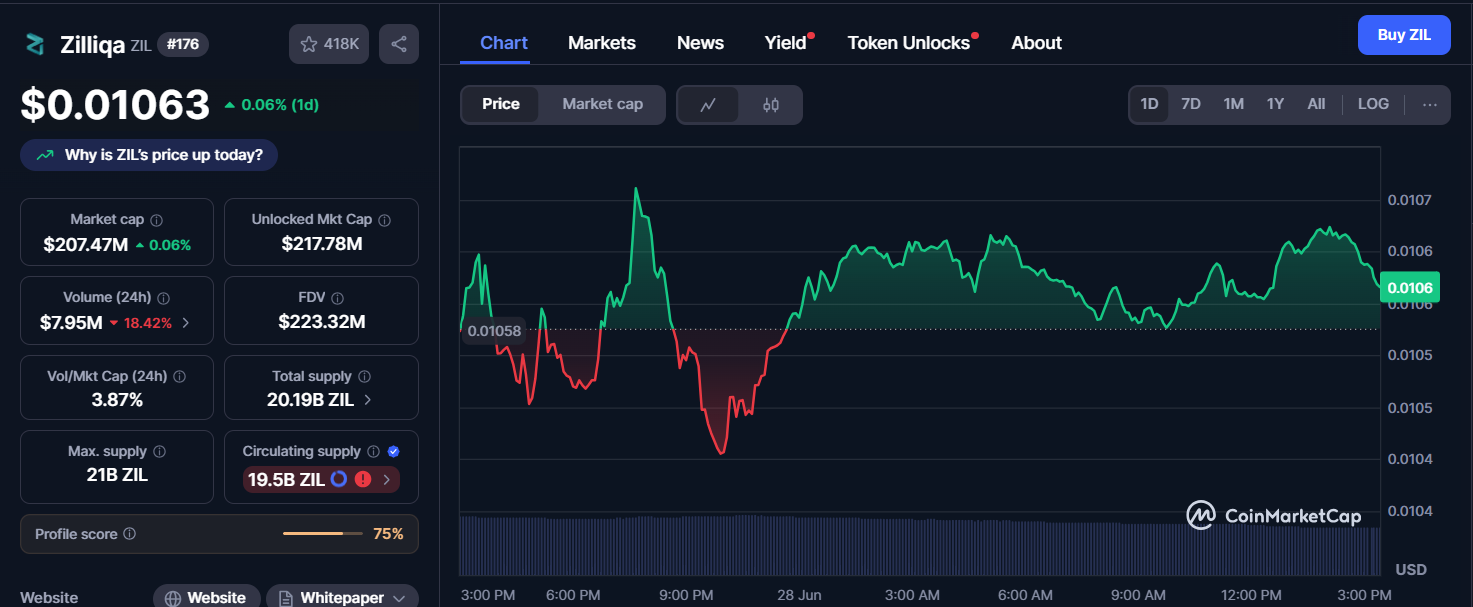
The 24-hour chart shows initial volatility followed by a steady climb in the second half of the session. The volume-to-market cap ratio reached 3.87%, indicating moderate trading activity. Circulating supply currently stands at 19.5 billion ZIL, with a maximum cap of 21 billion.
