

TUT Surges 150% From Entry as Price Hits New 2025 Highs Near $0.060

- TUT surged 150% from its earlier entry zone, reaching a high of $0.06056 with a 14.9% daily gain.
- The price broke above a long-term range and invalidated a descending wedge pattern formed since April.
- TUT now trades between $0.05161 support and $0.06056 resistance, maintaining bullish momentum on strong volume.
TUT/USDT posted a significant breakout over the last several trading sessions, gaining over 150% from the previous entry range. June 25, 2025, saw the asset hit another local high of 0.06056, representing a 14.9% rise on a daily scale.
At the time of writing TUT was trading at approximately $0.05941 rippling in the slightly below resistance zone, however, showing a strong bullish pressure. The pair also recorded a 13.9% rise against BTC, hitting Ƀ0.065582 on Binance. This upward move follows a long period of sideways trading between April and early June.
Volume Buildup and Range Breakout
TUT was bounded within a $0.02400 – $0.03000 range for nearly two months. It began to price action in mid-June, however. After the defense at $0.025, price action regularly built a higher base. Notably, volume surged when it broke out of the descending wedge formation. Breaking above $0.030 triggered an instant rally, propelling the price beyond previous resistance levels.
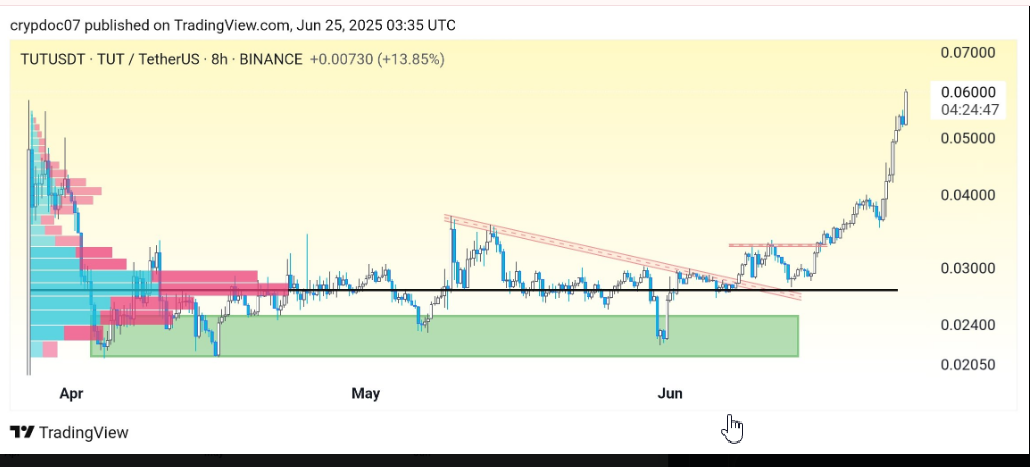
The breakout cancelled out the downtrend that had dominated from early April. Price broke out quicker since then, establishing a new pattern of trading. Activity in the $0.05161 zone confirmed new support, replacing the former range bottom. This level has since held firm as buying pressure persisted above it.
Short-Term Levels and Resistance
As of the latest session, TUT trades between a $0.05161 support and a $0.06056 resistance. Intraday activity touched the upper limit but retraced slightly. However, the price remains within striking distance of the current high. The asset also registered a strong move in the 8-hour timeframe, holding steady above previous key zones.
This price range now defines short-term behavior. Traders are closely monitoring whether TUT can establish a base above $0.060. For now, price remains elevated, supported by earlier consolidation and consistent volume growth since the beginning of June.
Historical Price Context and Current Structure
Historically, TUT struggled to sustain gains above $0.050. However, the structure shifted once price breached the $0.030 threshold. Following this level’s clearance, momentum escalated quickly, and the volume profile showed strong accumulation near the former consolidation range.
The green demand zone between $0.024 and $0.027 proved critical to this recovery. After multiple tests, it supported a broader structural reversal. Price action now shows a steep upward curve, reflecting continued market activity within defined technical boundaries.
