

Bitcoin Triangle Squeeze Signals Breakout with MVRV Rising and Price Near $110K

- Bitcoin’s price squeeze under $108K sets up for a sharp move, with $110K and $97K marking key breakout and sweep zones.
- Price compression in Bitcoin’s symmetrical triangle signals rising pressure as bulls and bears prepare for directional expansion.
- Bitcoin appears to be leaving undervaluation and beginning an early-stage bullish cycle, based on the MVRV Z-Score rebound from 0 to 1.1.
Bitcoin is gaining momentum for a breakout as it trades in a narrowing range below $108,000. Its next significant move may be determined by key levels that fall between $97,000 and $110,000.
Symmetrical Triangle Holds Market Attention
Bitcoin is locked inside a symmetrical triangle on the 4-hour chart, tightening from June 7 through June 19. The price has formed lower highs and higher lows, indicating clear compression around $105,295. According to an analysis by Titan of Crypto, this coil has reduced volatility and narrowed the range, with both bullish and bearish forces awaiting confirmation.
Earlier this month, following the breakout phase, Bitcoin began recalibrating within a defined wedge. The price is currently ranging from a resistance level close to $110,000 to a weekly low of $103,000. With $100,500 and $97,000 serving as historical downside magnets that traders are keeping a close eye on, these levels represent crucial liquidity points. The triangle’s apex is getting closer to resolution as the price stays below $108,000.
Assessing market structure, price remains technically neutral. While no clear direction is confirmed yet, pressure is mounting. Traders are reacting to the shrinking range by bracketing entries around both the support and resistance zones. Should Bitcoin close above $110,000, short liquidations may accelerate upside momentum rapidly. If it loses $103,000, sell pressure could intensify toward $101,000 and the deeper $97,000 zone.
Macro Chart Behavior Signals Accumulation Phase
Bitcoin’s long-term setup reflects a shift from undervaluation to steady recovery. The MVRV Z-Score (2-Year Rolling) recently bounced from sub-zero levels to 1.1. This historical trendline has signaled previous cycle bottoms, often lining up with heavy accumulation and bullish reversal setups.
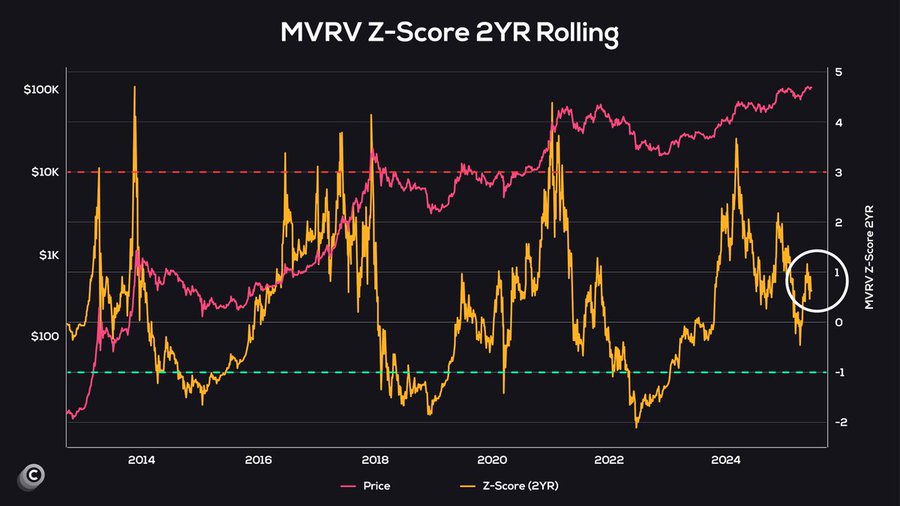
Bitcoin had macro bottoms in 2015, 2018, 2020, and 2022 when the MVRV Z-Score fell below zero. With the score now trending higher again, this structure indicates renewed market confidence. Bitcoin, still trading between $50,000 and $65,000 on the long-term log scale, is setting a base for a broader push.
Is the price building pressure for a parabolic leg, or will it retrace to deeper liquidity pockets? This remains a live question for market watchers. Price compression, historical MVRV metrics, and short-term liquidity behavior are aligning. The upside path sits at $110,000 and beyond. The downside narrative builds below $101,000, especially if price sweeps the $97,000 zone.
Bitcoin is trading in a decisive zone where structure, sentiment, and liquidity converge. This phase is not only directional—it is foundational for the next high-volatility wave. Traders continue to map entries using structure and risk thresholds as Bitcoin inches closer to breakout resolution.
